CircleSFR software
SFR/MTF analysis as a Python package.
Install with pip, point it at a chart capture, and read sagittal and tangential MTF across the field. Built for lab scripts and notebooks, not another GUI to learn.
$ pip install circlesfr

>>> import circlesfr
>>> result = circlesfr.analyze("capture_042.tif")
>>> result.summary["sfr50_sag_l"]     # cy/px
0.2609
>>> result.clipping.high              # per channel
(0.0021, 0.0018, 0.0016)What it measures.
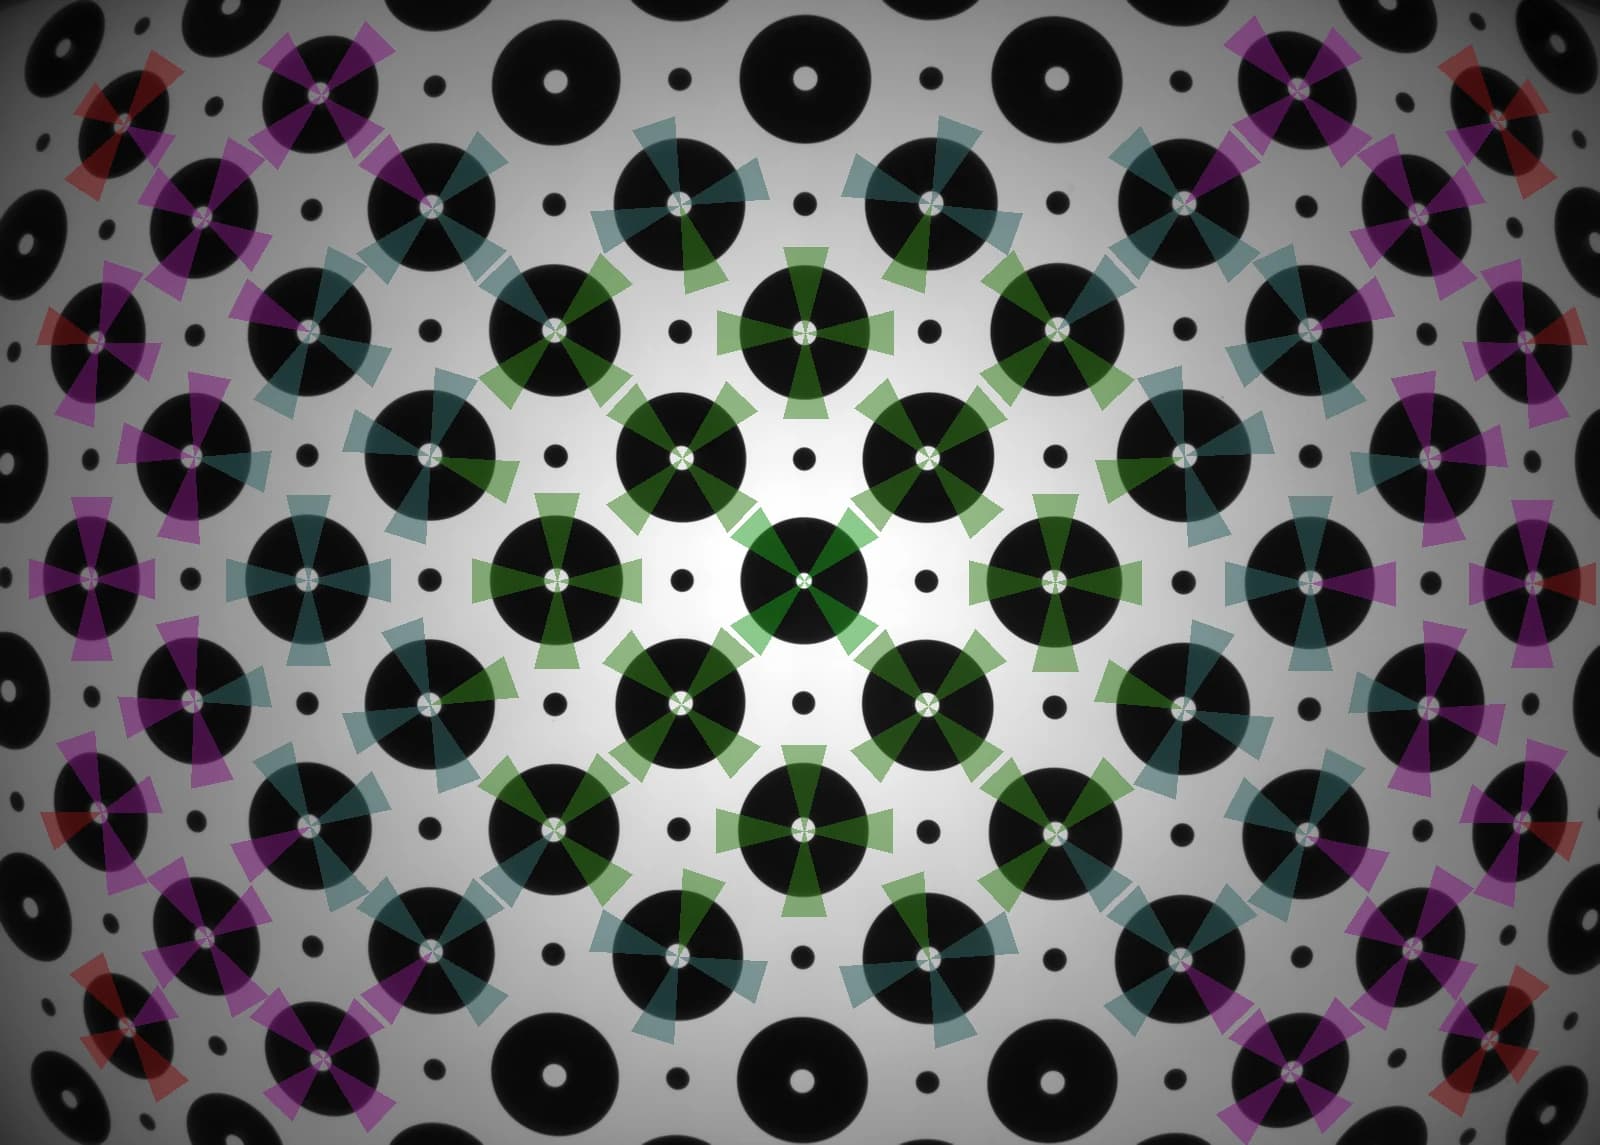
Detects all 83 ring markers, estimates radii, and derives analysis regions from one capture.
Four edge sectors per ring give a dense MTF map across the field, split by orientation.
Per-sector summary frequencies with sampling efficiency against Nyquist.
Per-channel low/high clipping fractions so bad exposures are caught before analysis.
Capture overlays color-coded by field radius for visual review.
Hann LSF windowing, edge-angle correction, and distorted-edge polynomial fitting, informed by ISO 12233:2024.
Roadmap, stated plainly: PyPI publication, CSV export, PDF reports, and a batch CLI are in development and are not sold as shipped features. Results are Python objects today.
Licensing that works in a lab.
Keys verify offline. Commercial use starts at $490 per seat per year — see pricing for all four tiers.
Ed25519-signed license file. No phone-home, no activation server — air-gapped labs supported.
Set CIRCLESFR_LICENSE or drop the key at ~/.circlesfr/license.key.
30-day evaluation key with full features; outputs are watermarked.
Sector overlays are color-coded by normalized field radius so center-to-corner falloff reads at a glance. Pair the package with the printed chart for a complete, repeatable workflow.
Read the quickstart